
What is a GANTT chart?
- A GANTT chart aims to establish a clear overview of all project elements.
- The diagram is a graphical schedule and overview of all parts and activities included in a project.
- Laurence Gantt introduced the GANTT chart in 1916 and is now called the father of waterfall planning.
- The diagram shows, using bars, the start and end dates of the project tasks and indicates the structure and status of the different contexts and activities in the project.
- In short, it is a manageable graphical timeline of a given project.
What does a GANTT chart show?
The horizontal bar charts constitute a visual representation and overview of the project’s activities and different phases.
The vertical axis of the diagram consists of the activities that formulate the project. The horizontal axis indicates time intervals of time spent or upcoming. The timeline can be broken down into months, as in the example below, or the chart can be broken into days, weeks or years.
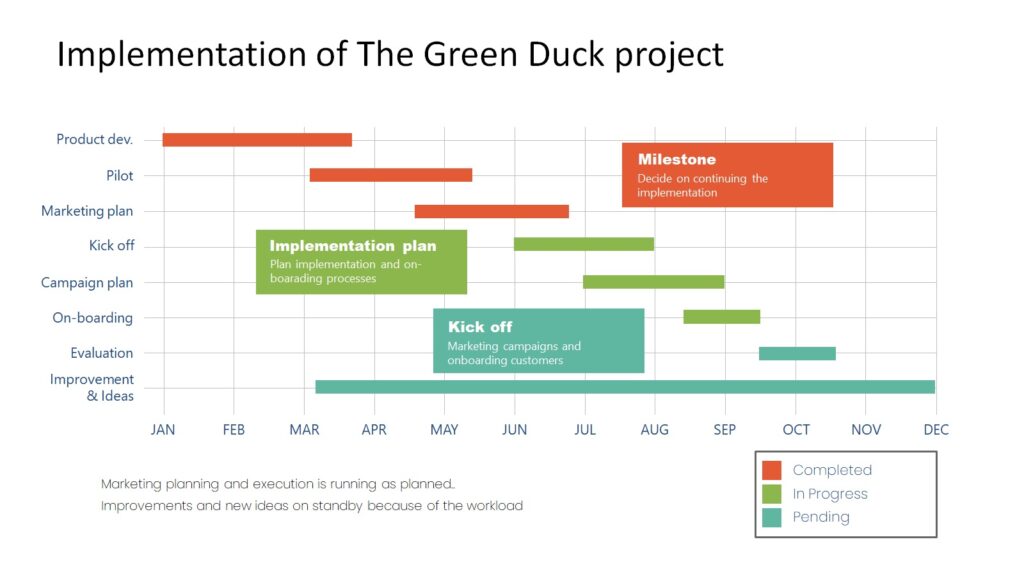
GANTT chart example
How to use a GANTT Chart?
A GANTT diagram is a valuable tool for project managers and others who wants to keep a leash on a project and its activities, contexts, and phases. The diagram provides a visual and straightforward overview of all project activities – and is a more visual planning tool than a simple to-do list.
It makes it easier for the project manager to plan the different activities and form an overview of when the tasks must be executed and the best way to carry them out.
In the chart, the project manager will have the opportunity to allocate resources to the different activities, making sense to the team and the steering committee. The project’s subtasks and activities can even be managed and coordinated in the diagram, allowing the project manager to watch how the project activities are constantly developing.
How to make a GANTT chart?
When making a GANTT chart, the project manager needs to have many elements beforehand. Start with brainstorming and write down all the project key activities the project manager and his team can identify. After that, the project manager can start listing the necessary tasks to achieve the sequence of the project activities:
- Schedule the start and finish dates of the tasks
- Create deadlines and milestones for the project
- Add dependencies between tasks
- Add resources and colleagues to the project
- Continuously update the tasks – and the project
Plan all the activities carefully. Assess which tasks need to be solved first. Because all planning need to be updated along the way, the project manager must ensure that the project activities are executed in the most efficient order. If one task is dependent on another, the activity should not necessarily wait to be initiated until the ones upon whom it is dependent are completed. Dependencies are common within IT-project and are one of the significant challenges of planning this kind of project because it is hard to identify when to start up one activity related to another, simply because much synchronisation has to take place between the activities.
What the project manager should not have in the GANTT chart
A GANTT chart is suitable for many projects, but it is also possible to make an imperfect version. It is about being both overarching and specific enough that creates the chart’s value – and not just take unnecessary time.
For example, the project manager rarely gets a good result if it contains a lot of small tasks that do not have a length of more than 1-2 days. If the project manager includes many small tasks, the to-do list will typically also be infinitely long for both medium and more enormous projects.
Conversely, do not make the GANTT chart completely overall either. For example, it quickly loses its value and eligibility by only including Startup and Deployment and measuring the various things in weeks and months instead of days.
Tools
There are various tools available to prepare a GANTT chart. Most used is Excel, PowerPoint and, best of all, MS Projects.
Get a free PowerPoint Gantt Chart template from slidemodel.com